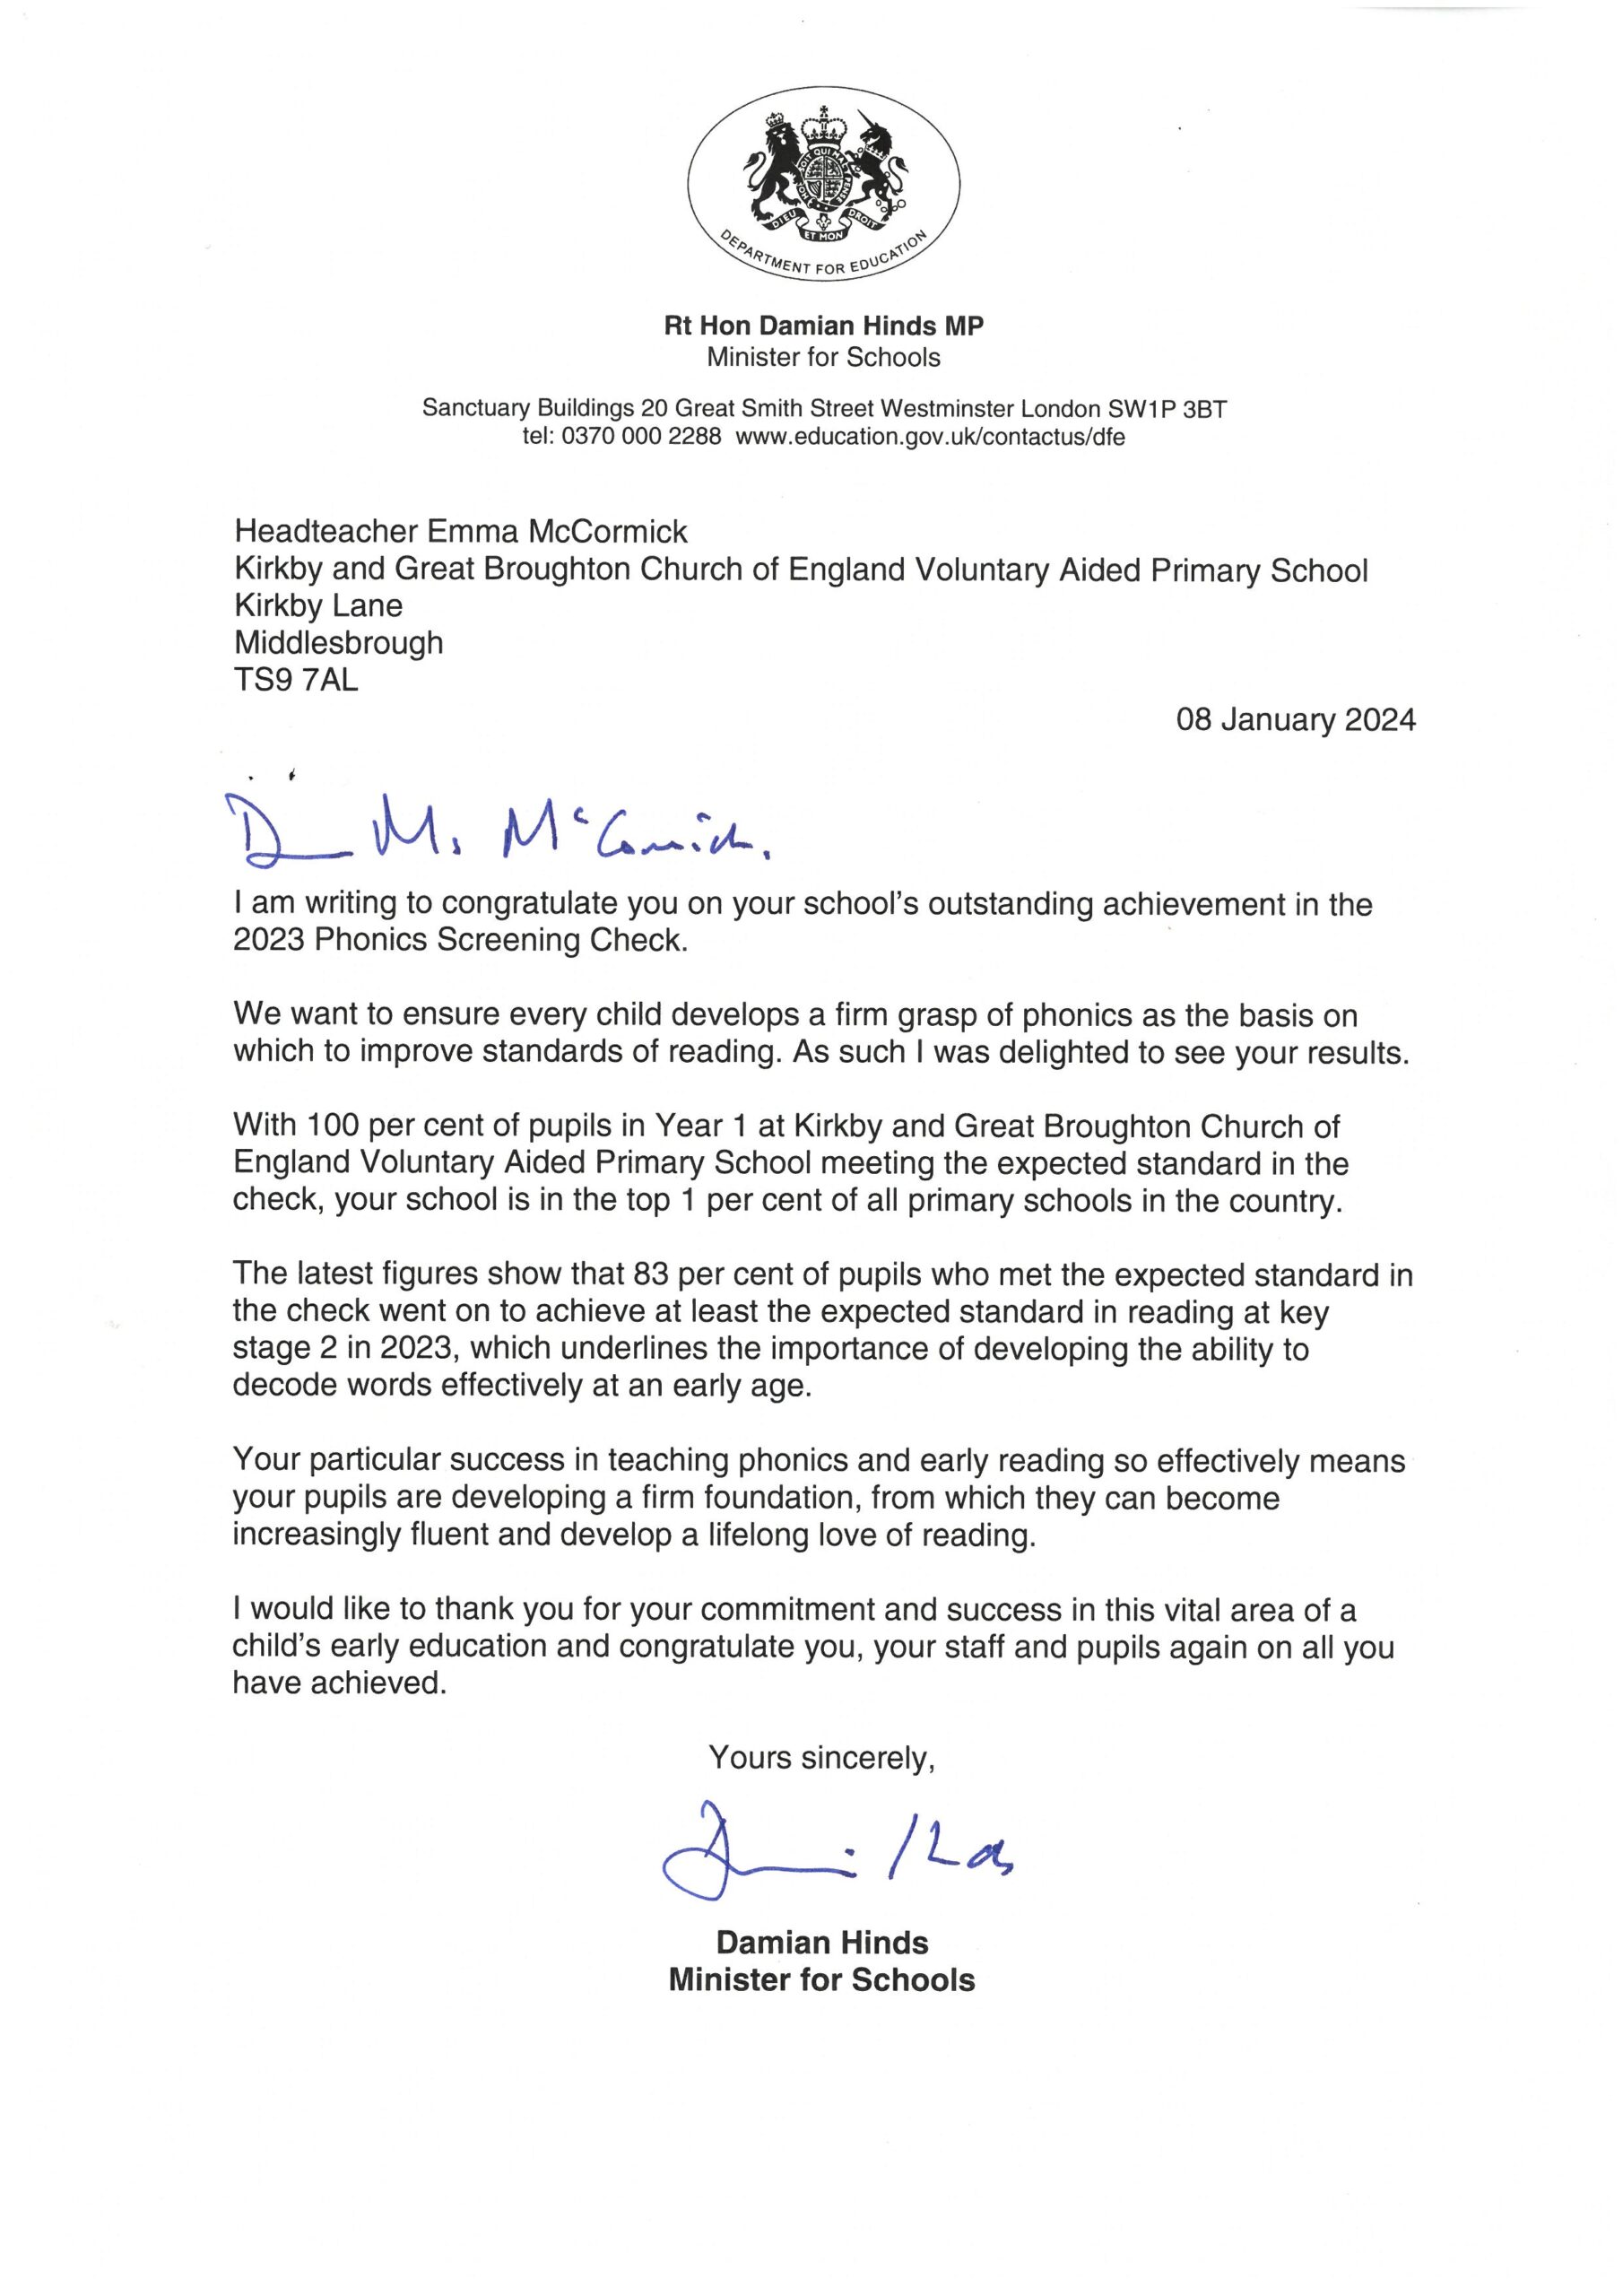
Pupils take statutory assessments (as required by the DfE) during their time at primary school These are mainly based on teacher assessment but do include some assessment tasks and tests provided by the DfE. Schools must report the results of these assessments to the DfE and the information is published.
These assessments are:
Early Years Foundation Stage Baseline Assessment (introduced September 2021) on entry to school.
Year 1 Phonics Screening in June
KS1 Assessments in reading, writing and maths in May and June of Year 2
Y4 Multiplication Tables Check in the summer term of Year 4
KS2 SATS in reading, writing, grammar, spelling and punctuation and maths. SATS tests are taken in May of Year 6. Writing is teacher assessed whilst the other subjects are assessed by a test
Statutory Assessments were cancelled in 2020 and 2021 due to the Covid 19 pandemic

DFE School Performance Tables
School Performance Tables as published by the DFE can be found by following this link:
2022 – 2023
Comparative information about the attainment of pupils of the same age nationally
| % meeting EXS or higher | ||
| Grammar Punctuation & Spelling* | KGB School | 81% |
| National | 72% | |
| Reading | KGB School | 93% |
| National | 73% | |
| Mathematics | KGB School | 81% |
| National | 73% | |
| Writing | KGB School | 81% |
| National | 71% | |
| Reading, writing and mathematics combined | KGB School | 75% |
| National | 59% | |
Initial progress estimates
|
|
Expected progress or better |
Above expected progress |
|
Reading |
100% |
50% |
|
Mathematics |
100% |
25% |
|
Writing |
94% |
12% |
2022 – 2023
Progress in reading*
School
Confidence Interval
2.7 to 9.1
Banding
Well Above Average
Progress in writing*
School
Confidence Interval
1.5 to 4.6
Banding
Average
Progress in maths*
School
Confidence Interval
1.1 to 7.1
Banding
Well Above Average
Percentage of pupils meeting the expected standard in reading, writing and maths
- School 75%
- Local Authority Average 56%
- England Average 60%
Percentage of pupils achieving at a higher standard in reading, writing and maths
- School 13%
- Local Authority Average 7%
- England Average 8%
Average score in reading**
School
Local Authority Average
England Average
Average score in maths
School
Local Authority Average
England Average
* The scores are calculated by comparing the key stage 2 test and assessment results of pupils at this school with the results of pupils in schools across England who started with similar assessment results at the end of the previous key stage – key stage 1.
A score above zero means pupils made more progress, on average, than pupils across England who got similar results at the end of key stage 1.
A score below zero means pupils made less progress, on average, than pupils across England who got similar results at the end of key stage 1.
** This score is known as the reading ‘scaled score’. The score is an average for pupils in the school. The expected standard is a score of 100 or more. The higher standard is 110 or more.
